Discover | Tableau Public
Explore stunning data visualizations and the talented community that creates them on Tableau Public.
En bref
Ajouté le
18 mars 2026
Matière et domaine
coding · data-science-analytics
Niveaux scolaires
9e année (3e)–12e année (Terminale)
Type de page
Directory
Introduction
Tableau Public Viz Highlights
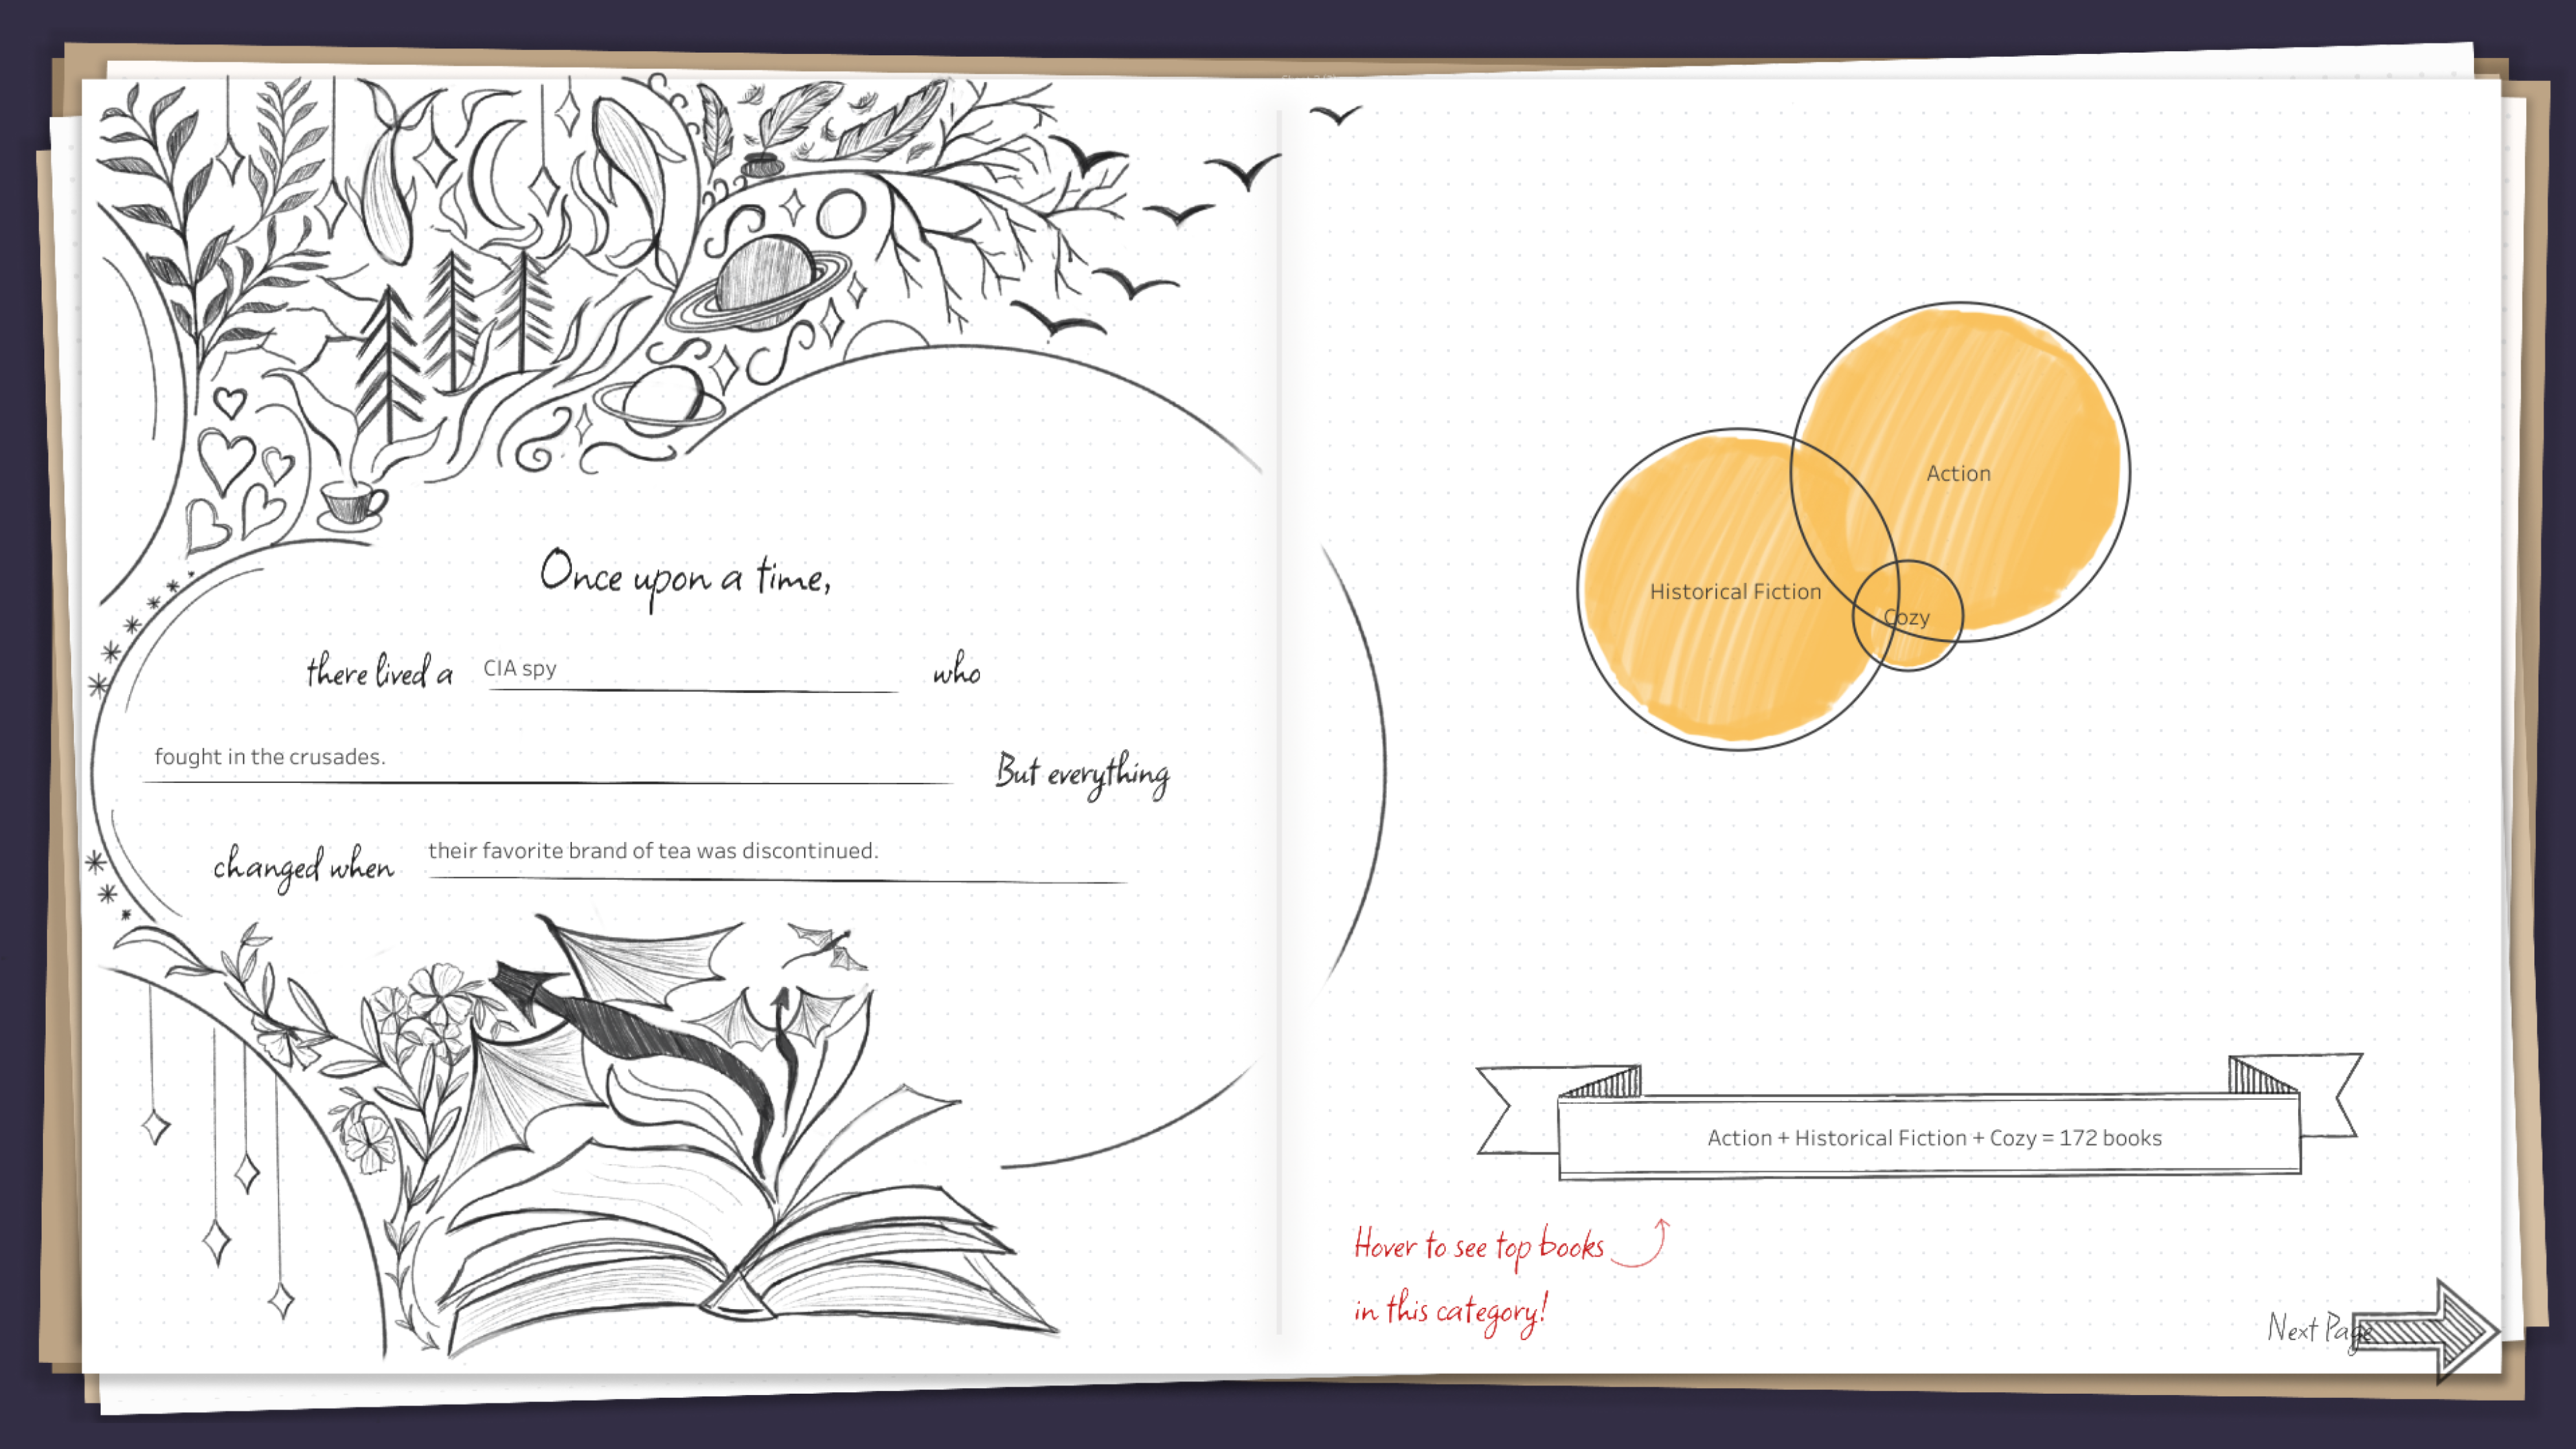
- Featured Viz of the Day: A data visualization by Ann Pregler analyzing Goodreads data to explore literary genre mashups.
- Key Themes: The project tracks trends like the rise of paranormal romance and identifies emerging literary combinations.
- Recognition: The featured work is identified as an #IronViz 2026 winning visualization.
- Content Focus: The platform highlights community-driven data storytelling, including specific spotlights on Tableau Ambassadors (EMEA) and AAPI Heritage Month.
Avis de la communauté
Pas encore d’avis publiés. Soyez le premier à partager votre expérience.